Collect(d)ing Expressway Metrics
Configuring a collectd receiver for Expressway metrics
In this blog post, we'll show you how to quickly setup a collectd reciever which you can use to store Cisco Expressway metrics.
Cisco's Expressway series appliances have the capability to send metrics to an off-box collectd receiver. The amount of information that comes in about the hardware and service-level performance is abundant. You can monitor MRA, B2B video, etc.
- Prepare an Ubuntu server
The first thing you need to do is install a fresh (or repurpose an existing) Ubuntu server. I'm using Ubuntu 20.04 LTS, but I'm pretty sure 18.04 would be fine as well. The server needs to be reachable via IP by your Expressway system and have UDP port 25826 open across the communication path.
- Install collectd
After you have the Ubuntu server ready to go, you'll need to install the collectd package.
sudo su -
apt-get -y update
apt-get install -y collectd
The collectd installation will place a configuration file in /etc/collectd/collectd.conf. This file has a lot of great comments and sensible defaults, but I've provided a config file below that you can use to set things up for Expressway quickly.
In this case, we configure collectd to listen on the network for incoming data from the Expressway and we output it to .csv files.
- Configure collectd
Use the config file below, updating the setting for your IP address.
cp /etc/collectd/collectd.conf /etc/collectd/collectd.conf.bak
rm /etc/collectd/collectd.conf
vim /etc/collectd/collectd.conf
Paste the following into the config file after changing the listen IP address.
# The logfile plugin will log interesting data about collectd
LoadPlugin logfile

# The network plugin will listen on an interface for incoming collectd information
LoadPlugin network

# The csv plugin wil write the output to .csv files in the configured directory.
LoadPlugin csv

<Plugin "logfile">
	LogLevel "info"
	File "/var/log/collectd.log"
	Timestamp true
</Plugin>

<Plugin "csv">
	DataDir "/var/lib/collectd/csv"
	StoreRates true
</Plugin>

<Plugin "network">
	Listen "<YOUR_UBUNTU_IP>" "25826"
</Plugin>


<Include "/etc/collectd/collectd.conf.d">
	Filter "*.conf"
</Include>
If you check the original collectd conf file it has a lot more than this one. I trimmed everything down so that it's easy for me to understand at a glance.
- Restart collectd
systemctl restart collectd
systemctl status collectd
collectd should be listed as active (running). If it's not, check your log file (/var/log/collectd.log) and restart collectd.
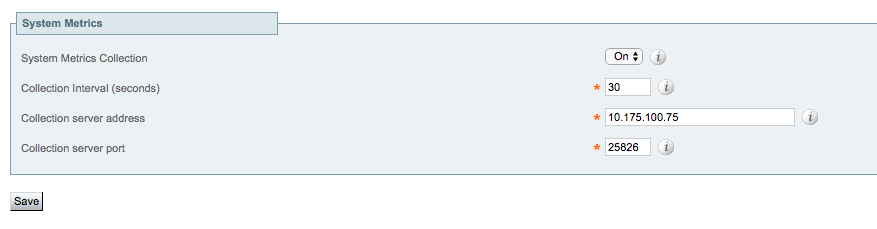
- Configure the Expressway to point over to your new collectd receiver.
Log into your Expressway system and navigate to Maintenance -> Logging. Under system metrics you can enable collectd to send to your system.
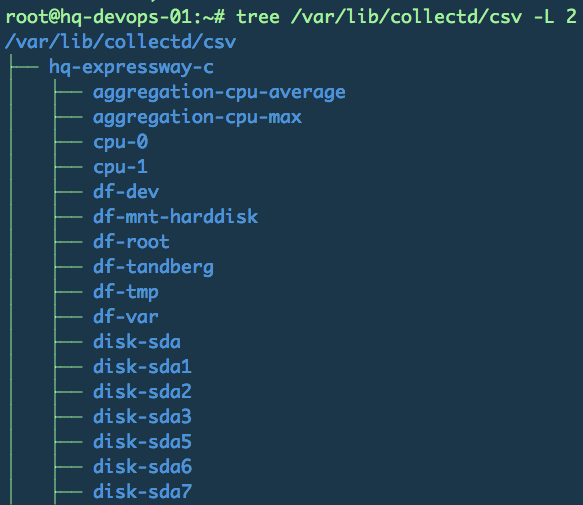
- Check your csv files
If everything went right you should have a nice structured set of folders containing all the collectd metrics under /var/lib/collectd/csv
And that's a wrap. I'll try to do a follow up to this one and explain how I configured collectd with the write_splunk plugin to send these metrics over to Splunk via the HEC interface.